A character driven world shaped by geology
I am developing an original video game concept that combines character focused storytelling with a world influenced by geology, terrain, minerals, underground environments, and natural processes. The goal is to make these ideas part of the setting and adventure rather than present them as a separate lesson.
These drawings are early visual explorations for the cast, their relationships, clothing, and important places. As the concept develops, landscapes, materials, hazards, and environmental change can shape how the characters travel, solve problems, and understand their world.
Building a cast before building the game
The character sheets explore silhouette, proportion, expression, clothing, and personality. They are working designs for a future game, so some pages show several alternatives rather than a single final answer.
A childhood home shaped by terrain and memory
This work in progress explores an important place from Duan's childhood. The house, mature tree, exposed rock, water, and vertical paths begin to connect personal memory with the geology inspired setting of the game.
Using fan art to study atmosphere and visual storytelling
This completed Madara Uchiha fan art is separate from the original game concept. It demonstrates a more resolved illustration process through composition, color, lighting, environment detail, and character interaction.
Turning engineering data into a readable technical story
Material Point Method results can describe complex water movement, but raw particle files and velocity values are difficult to interpret outside a specialist workflow. This project developed a visual pipeline that preserves the engineering sequence while presenting the behavior as a clear 3D animation.
Define the physical study before building the scene
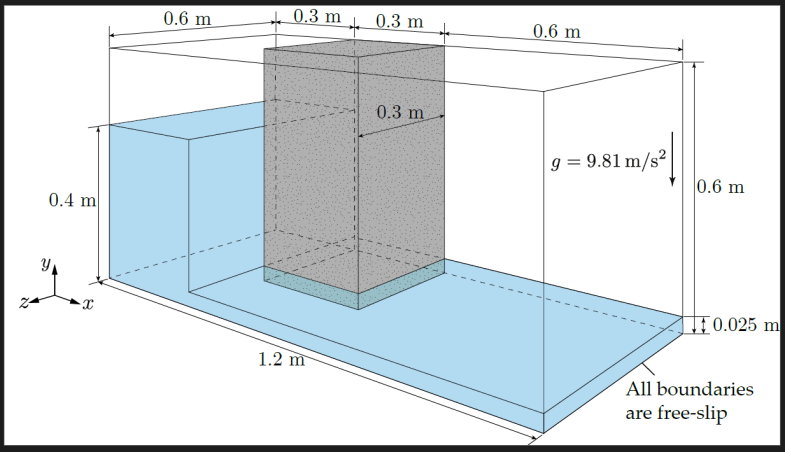
The source study represents water moving through a rectangular domain with a dense crushed rock block acting as a barrier. The model records particle position and velocity through time, allowing the flow to be compared on the obstructed and unobstructed sides of the structure.
The first task was to translate the study dimensions, boundary conditions, and barrier location into a visual setup that remained faithful to the engineering model. This established the scale and spatial relationships used throughout the animation.
Convert the MPM time series into a Houdini ready sequence
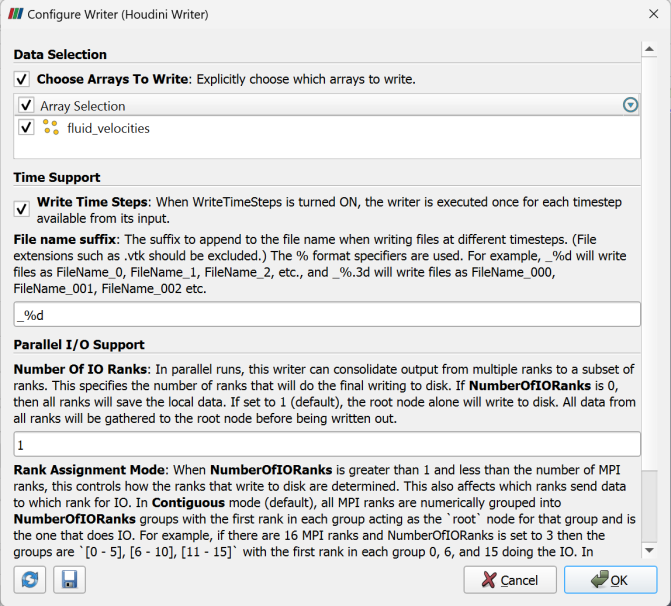
The original simulation was delivered as a sequence of VTP files. ParaView was used to select the particle arrays, preserve the time steps, and export the data in Houdini geometry format. This conversion retained the fluid velocity attributes needed for later visualization.
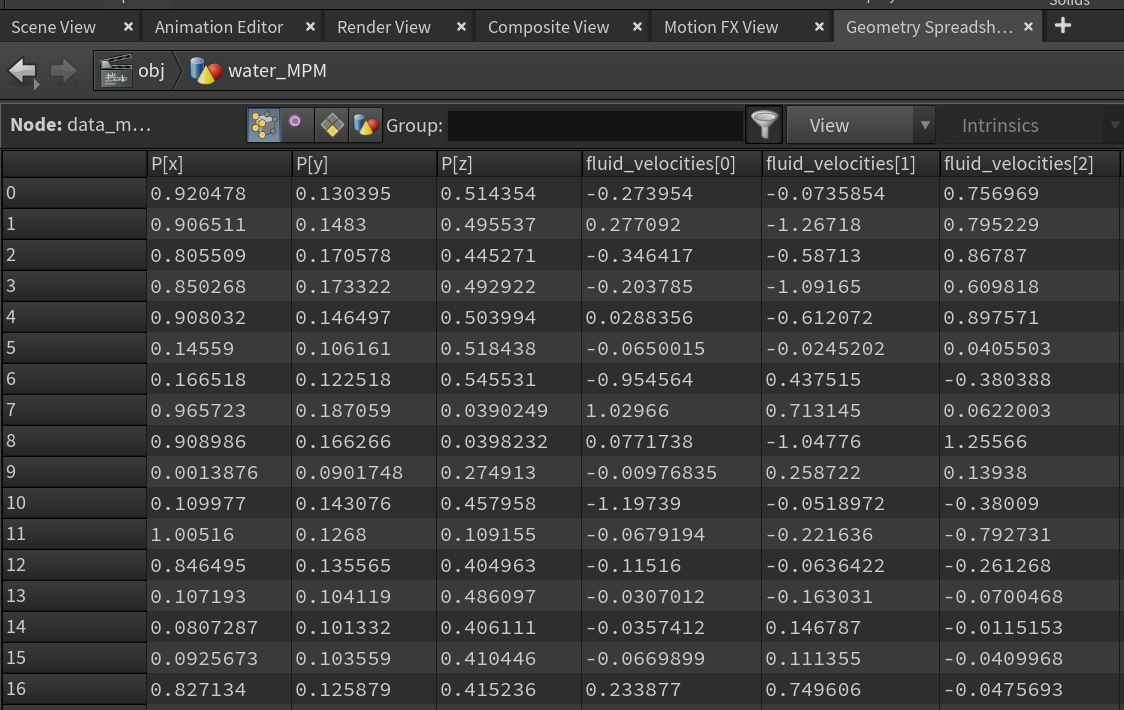
Inside Houdini, the sequence was inspected through the Geometry Spreadsheet. Time Blend was used to interpolate between stored steps, while File Cache reduced repeated computation and made the heavier scene easier to review, refine, and render.
Build a rock barrier that matches the model but reads naturally
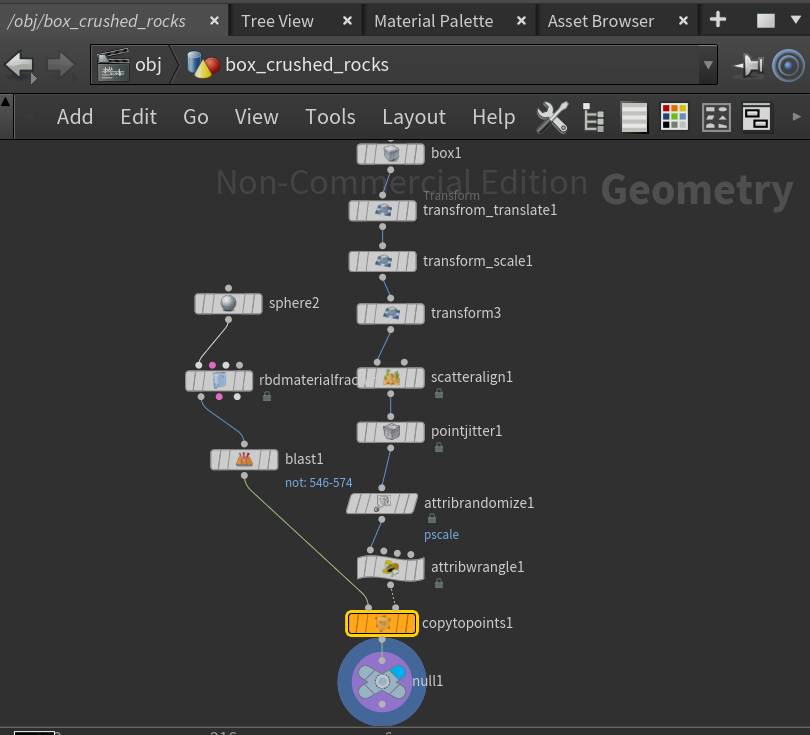
A simple solid block would communicate the dimensions but not the granular character of crushed rock. A procedural Houdini network was therefore used to fracture a base shape, isolate irregular fragments, scatter placement points, and introduce controlled variation in position, rotation, and scale.
The fragments were copied across the barrier volume to create a densely packed structure. This preserved the intended 0.3 by 0.3 by 0.6 meter footprint while giving the rendered barrier enough surface variation to read clearly under lighting.
Transform particle motion into a continuous water surface
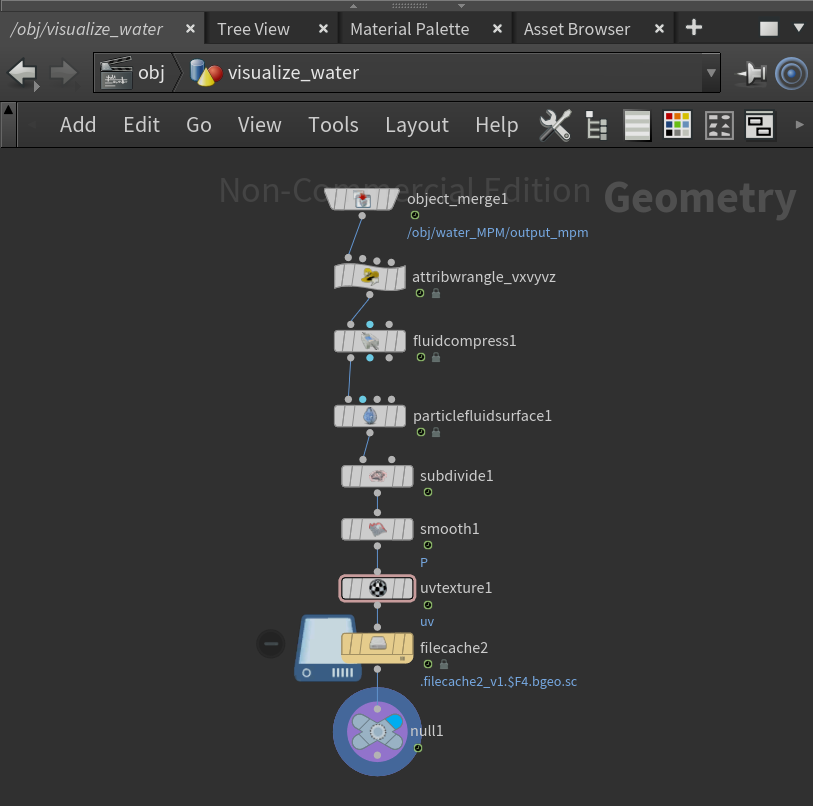
The simulation data already contained the water movement, so the goal was not to create a new fluid simulation. Instead, the workflow prepared the existing MPM points for visualization and reconstructed them as a continuous renderable mesh.
Particle Fluid Surface controlled the conversion from points to surface. Particle separation, voxel scale, influence scale, filtering, and smoothing were balanced to preserve splashes and changing water depth without producing an excessively heavy or fragmented mesh. The result was then refined, mapped, and cached for consistent rendering.
Use material, light, and camera decisions to explain the motion
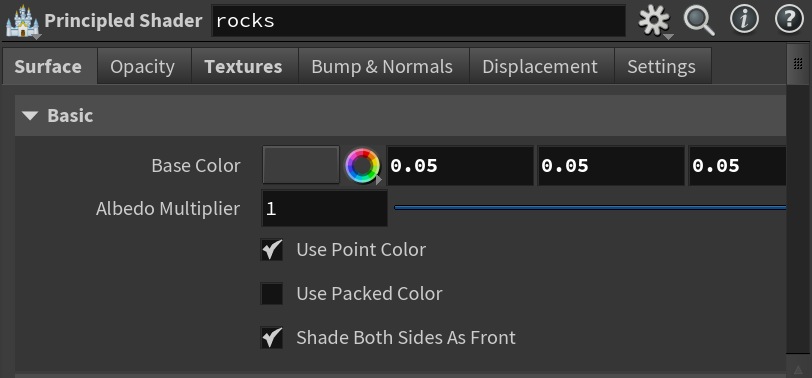
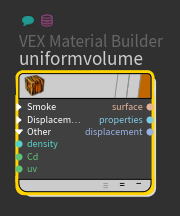
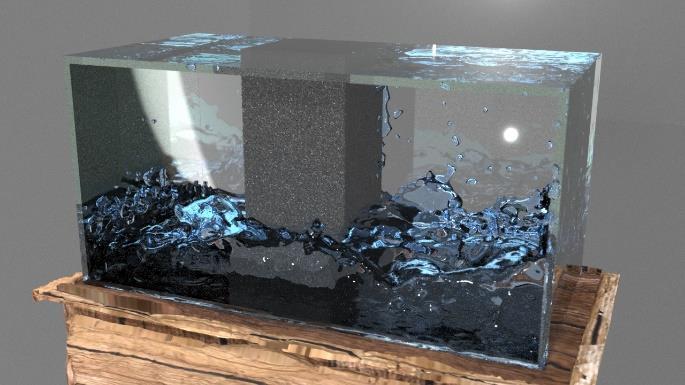
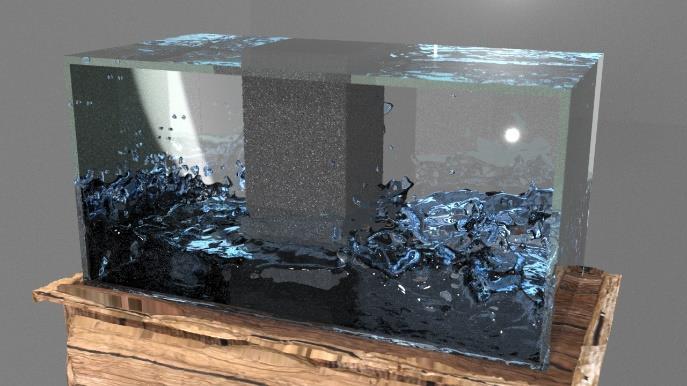
The barrier received a dark rock shader, while the water combined a volume treatment for depth with a liquid material for reflection and surface clarity. These choices helped distinguish the two materials and made changes in water depth easier to see across the sequence.
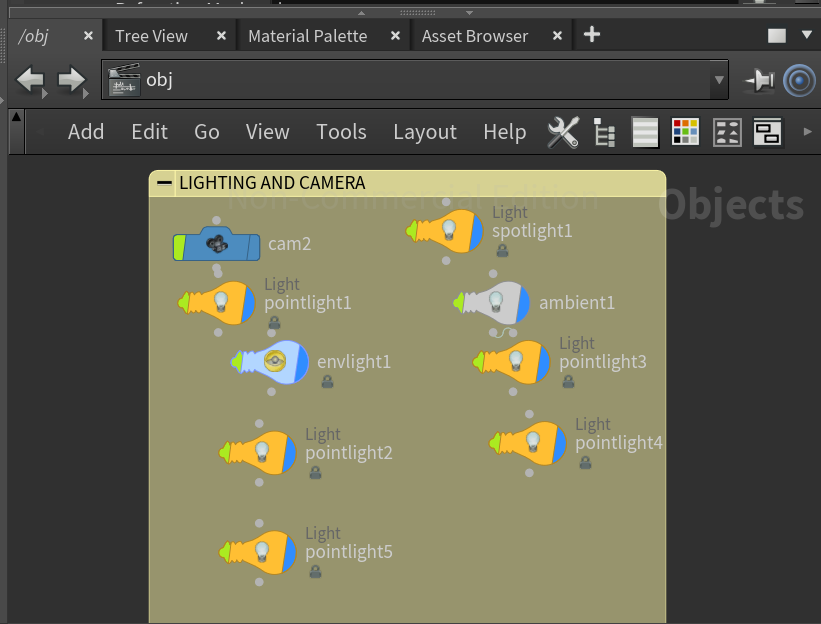
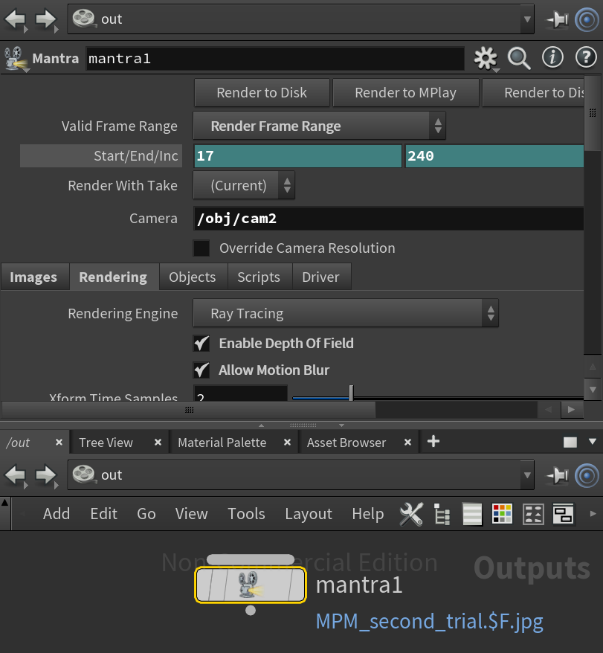
Multiple point, spot, ambient, and environment lights were arranged around a fixed camera. Mantra ray tracing was used for the final output, and the model was staged inside a transparent aquarium style enclosure with a restrained backdrop so attention remained on the interaction between the water and barrier.
Following the water as it meets and moves around the barrier
The rendered sequence makes the progression of the engineering data easier to follow. These four frames show the flow developing around both sides of the barrier, the changing surface shape, and the way the enclosed water redistributes later in the sequence.
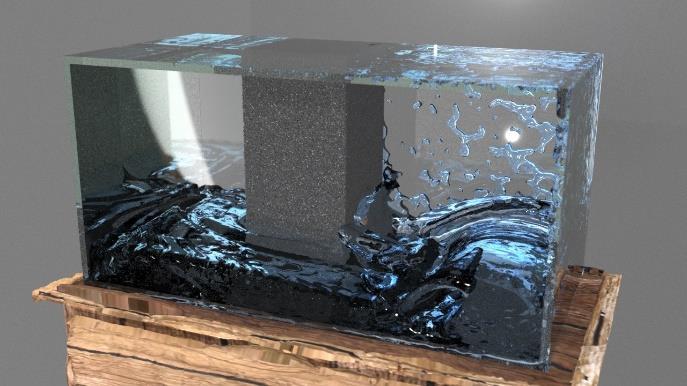
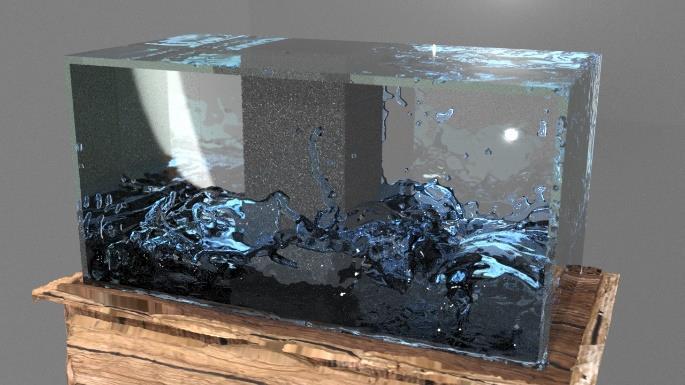
The project demonstrates how technical animation can bridge numerical modeling and engineering communication. The result is not a replacement for simulation analysis; it is a visual layer that helps specialists, collaborators, and nontechnical audiences understand the same time dependent behavior more quickly.
Read the Full ReportOne mining career, two connected geotechnical chapters
My work at the Grasberg minerals district moved between long-range subsidence forecasting and day-to-day underground engineering. I have kept both stories together here because they show the same responsibility at different scales: understand how the rock mass is changing, identify what may be exposed, and turn that evidence into safer operating decisions.
A mine district connected vertically
The Grasberg Block Cave sits below the Grasberg open pit. Around the Ertsberg area, the Deep Mill Level Zone sits below the Deep Ore Zone. Continued extraction causes the caved and fractured rock mass to propagate upward, so an underground production decision can eventually affect higher mine levels, surface slopes, roads, equipment, and critical infrastructure.
That vertical relationship is the foundation of the case study. Subsidence is not a single instant when everything collapses; it develops over time, which creates an opportunity to forecast, monitor, communicate, and act.
Forecasting where the cave would travel and what it could affect
As a founding member of the Subsidence & Transition team, I developed time-based models of cave growth and subsidence impact. The objective was practical: give teams enough warning to decide whether infrastructure should remain in service, receive additional support, be relocated, or be removed before exposure became unacceptable.
Compare the forecast with the cave that actually formed
I modeled the expected cave geometry for the active GBC production blocks and compared it with the interpreted actual cave. A close spatial match increased confidence in using the model to examine future propagation and possible interaction with the bottom of the Grasberg pit.
This calibration step mattered because a model was only useful if operations could understand both its prediction and its uncertainty.
DMLZ cave propagation toward DOZ
Play the sequence or move the slider to follow the modeled cave from 2020 Q1 through its breakthrough into the overlying DOZ cave zone in 2021.
A forecast was continuously checked against field evidence
No single instrument could describe the whole system. I worked with complementary surface and underground observations, including InSAR, ground-based radar, prisms, GPS, cameras, 3D scanning, seismic monitoring, resistivity, convergence measurements, Elexon, and TDR.
Read the trend, not only the latest measurement
Camera observations showed changing surface conditions while IBIS radar supplied movement trends for specific areas of the pit. I compared those readings with prism, seismic, and InSAR evidence to distinguish localized change from a broader acceleration pattern.
The goal was to translate many technical signals into a concise operational update: where movement was occurring, whether the trend was changing, and which area required closer attention.
Test whether future mine infrastructure intersected predicted deformation
For the proposed GBTA area, I overlaid the planned outline with the 2019 DOZ cave, InSAR displacement, and modeled plastic strain. The intersection made the subsidence exposure visible in one view and supported a direct safety discussion about whether and how the area could be developed.
This is the core of my subsidence work: not producing a model as an endpoint, but using it to help another team make a defensible decision.
The forecast helped departments choose an exposure strategy
From underground observation to ground support and stope design
Big Gossan was a different assignment from the subsidence program. As a site geotechnical engineer, I evaluated open stopes, inspected newly developed or damaged headings, documented rock mass conditions, and converted those observations into ground support and design recommendations.
Start with the mining sequence and the ground around it
The stope model tracked areas that were active, being mucked, awaiting paste fill, already filled, or still empty. I paired that operational status with a stope note developed alongside the geology team, documenting lithology, structures, faults, weak zones, RQD, and potential failure locations.
This gave mine design and operations a shared view of both the planned excavation and the ground conditions it would encounter.
Turn the stope assessment into an installation pattern
I evaluated the stability of the stope walls and wings, then used the result to recommend practical support such as cable bolts and split sets with location-specific spacing. The final note connected the analytical result to something construction crews could install.
Verify the design against the heading that exists underground
I inspected new headings and responded to reported damage or rockfall conditions. The field record captured rock type, discontinuities, water, dimensions, existing support, and missing or damaged elements before a location-specific recommendation was issued to ground support and mine design teams.
Test a modified stope before assuming it is safer
I compared the original and proposed stope dimensions across two mining steps. The modification did not produce a uniform improvement: selected step-one sections reduced stress, but step two developed greater sidewall concentration and a more pronounced bulging response. The comparison demonstrated why geometry and paste sequence needed to be assessed together.
Engineering judgment built from models, instruments, and direct observation
Across both chapters, my role was to connect evidence that lived at different scales: a district-wide cave forecast, an eleven-day satellite update, a radar trend, a new underground heading, or a stress concentration around one stope. The value came from bringing those observations into a form that other teams could understand and use.
Aayush Gupta · Ethan Yu · William John Molnar-Brock · Yulia Nugroho
Start with a digital brushstroke
Brush shapes carry both color and a height profile, giving each mark the depth of a paint stroke.
Build the image, stroke by stroke
Iteratively adjust placement, rotation, scale, and color to reconstruct the reference with a painterly character.
Bring the paint into 3D
Combine the canvas and its heightmap into a textured mesh, then render the surface in Houdini.
Project Gallery
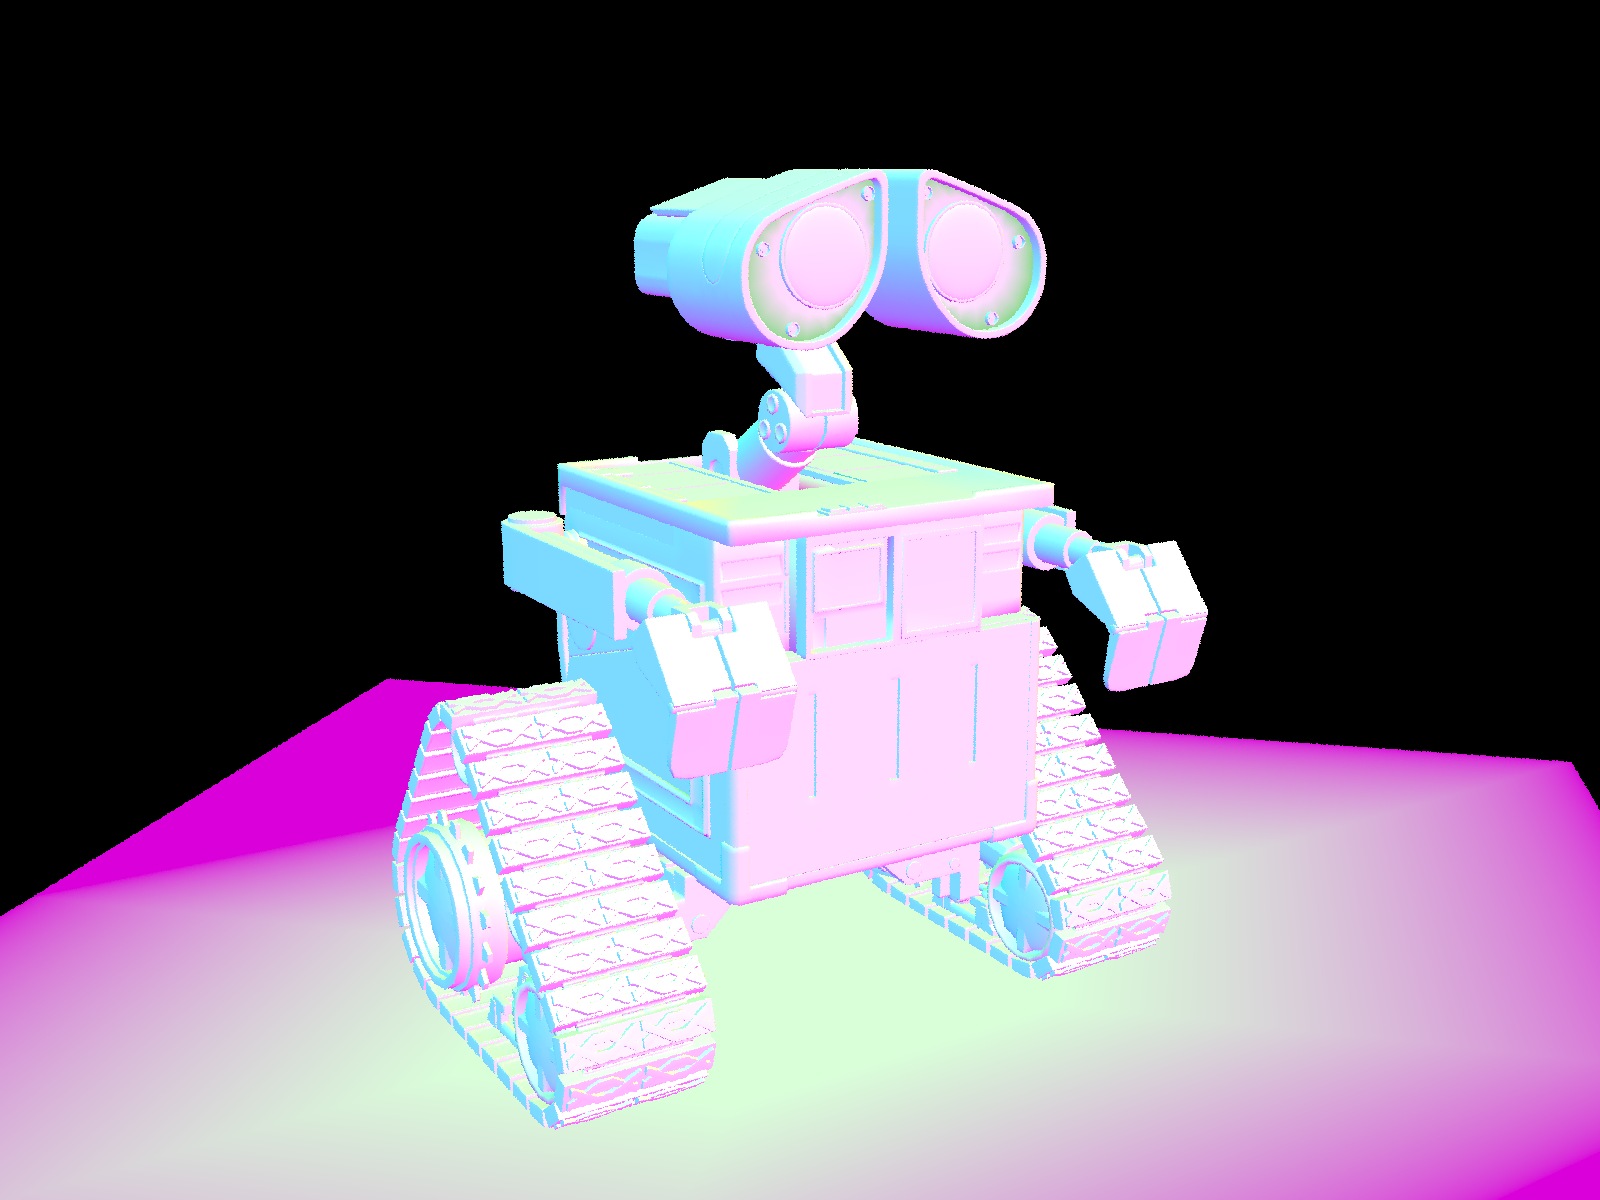
Selected studies from UC Berkeley CS184/284A explore how light, geometry, and physical behavior become images. Click any result for a closer look, or view the ray traced robot study.